Does reducing fees increase revenue: Context and TAM [1/7]
Posts in the series: Intro, 1/7: Context and TAM, 2/7: A conceptual model, 3/7: Externalities and breaking even, 4/7: Dynamics over time, 5/7: Testing approach, inferring results, next steps if test fails , 6/7: Metrics , 7/7: Takeaway, Google Sheets with data
The Context:
Imagine working for the Monetization team at an online marketplace that sells a wide range of products, from phone cases to perfumes, clothes, and collectibles. This marketplace hosts millions of consumer and business sellers, all drawn to the platform by its ability to attract tens of millions buyers.
The marketplace generates revenue primarily through two methods: charging sellers a listing fee and taking a percentage of the sales value from transactions. Fee structures vary based on the type of seller. For example, consumer sellers receive 20 free listings each month, after which they are charged $0.30 per listing. Business sellers, who subscribe to one of three store tiers, receive different benefits. Specifically, those at the Basic tier receive 150 free listings per month and are then charged $0.25 per listing. Moreover, business sellers pay a subscription fee: $16 per month for an annual Basic store subscription or $20 for a monthly subscription. All sellers however are subjected to 10% sales fees. This fee structure is outlined in the table below.

Table 1: Fee Structure
The marketplace consists of 92% consumer sellers, who account for 42% of the total listings per month and 23% of the GMV per month. A breakdown of the sales related metrics by seller type is shared in the table below.

Table 2: Monthly sales related metrics
There have been some grievances expressed on seller forums regarding the free listing allotment being too low for consumer sellers. Looking for opportunities to monetize, we wonder: what if giving away more free listings increases inventory on the site, thereby boosting sales and consequently, sales fees? Could the resulting increase in sales fees offset the loss of listing fees, thereby increasing net revenue?
If this approach works out, we would make both the sellers happy—increasing retention—and contribute to marketplace goals through enhanced monetization: a win-win scenario.
We want to waste no time and jump right in to validate the idea of course. However due to the scale of the marketplace, tests can be costly to run. Not only are there opportunity costs of running a particular test, but giving away free listings may incur large financial costs. There might also be unanticipated consequences or negative externalities that may come up. A bad seller experience due to the test may even negatively impact retention.
And so we do an exercise of trying to understand some basic questions: 1)How large is the test target? 2)What could be the elasticity of listings and fees with respect to allotment changes? 3)What could be the negative externalities? 4) Do we test all allotments or can we test a subset and infer the outcome of the others? 5)What might be the impact of allotment changes over time?
Below is an exploration of the aforementioned questions and some more.
Section 1: What is the TAM of sellers who can scale?
First of all, the idea operates on the premise that listing fees, rather than the ability to scale, limit sellers. But how valid is this assumption at scale? Is there evidence in our current data to support or refute this assumption? Can listing fees be the concern of only a handful of sellers?
To understand this, we need to examine the percentage of sellers at each listing level within the 20 free allotment world.
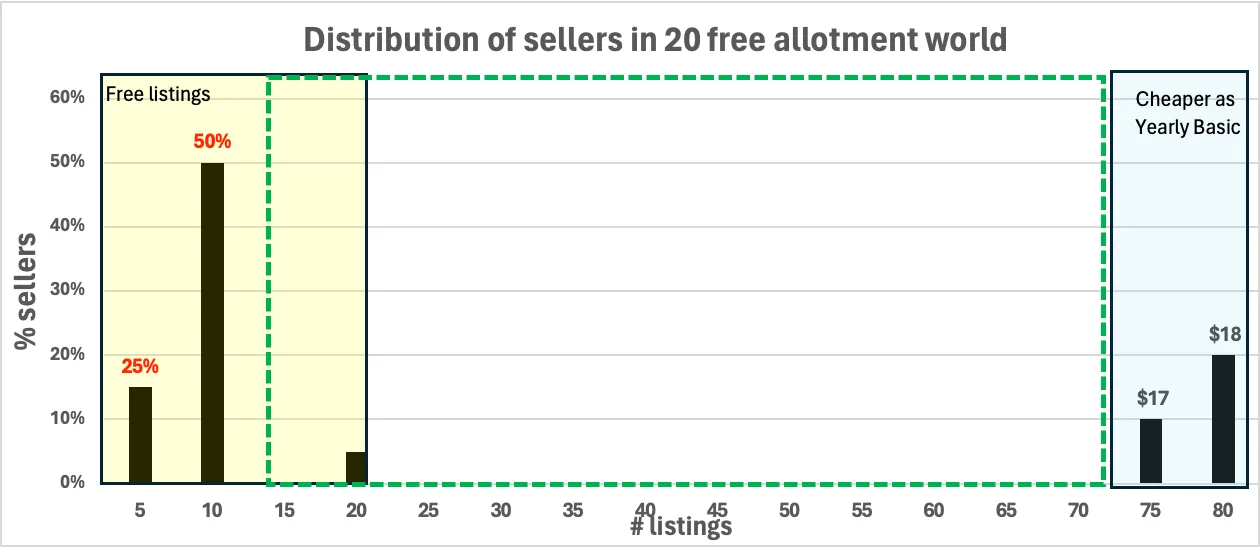
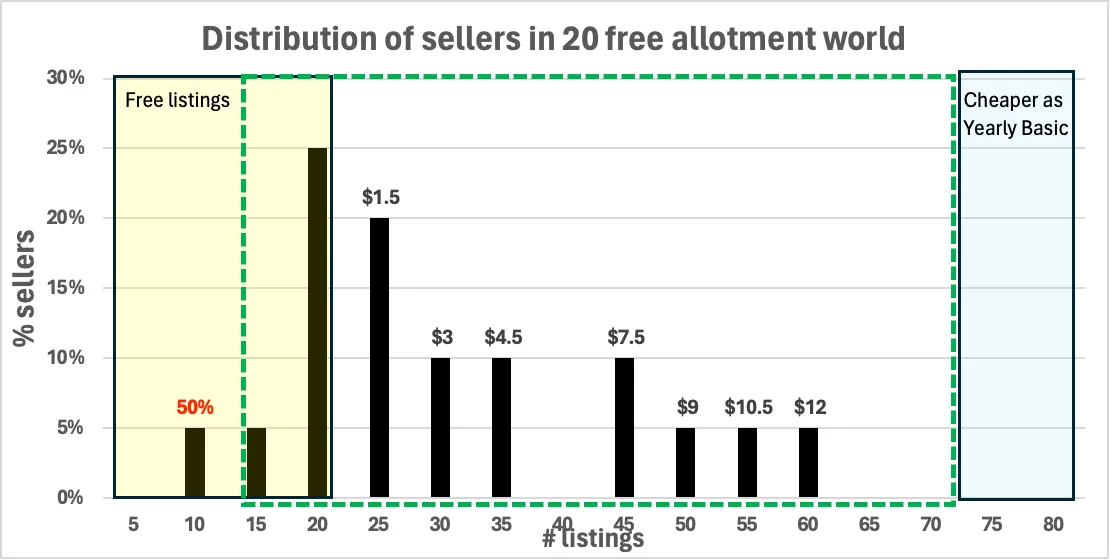
Below are two different scenarios where, despite the varied seller distribution with regards to the number of listings made, the average listing count is 30 in each case. However, the distributions are key to indicating the potential responsiveness of sellers to an increase in free allotment.

Chart 1: Depiction of Scenario 1.1, where sellers are clustered to the extreme left or right
In this first scenario, for instance, sellers are skewed either to the extreme left or extreme right. 65% of the sellers use 50% or less of their free allotment utilization (as indicated by the red text above the bars for sellers with 5 and 10 listings, respectively). These sellers are unlikely to be constrained by budget limitations, given they still have more than half of their free allotment available. They are either unwilling or unable to scale, making it reasonable to expect them to be unresponsive to an increase in allotment.
Conversely, 30% of sellers choose to pay $17+ to list 75+ items as Consumer sellers, instead of opting for a Yearly Basic store subscription at $16/month, which would allow listing those 75+ items (and up to 150 items) for free. It seems improbable that these sellers are restrained by a listing budget – if they were inclined or able to scale effectively, they would have opted for the Yearly Basic store, paying less per month and potentially increasing their listings by 1.8 times for free. Therefore, it is also reasonable to assume they would be unresponsive to an increase in free allotment, as they would have already utilized such an option if free listings were a priority.
The area within the green dashed lines indicates the region where we could expect the highest likelihood of sellers being constrained by their listing budget. This is the segment where we might anticipate the most significant response to an increase in allotment. In the scenario considered here, this group comprises 5% of Consumer sellers, i.e. 500k sellers.

Chart 2: Depiction of Scenario 1.2, where seller distribution is more compact
In the second scenario, however, sellers are closer to the 20 free allotment cutoff, which might indicate greater sensitivity to allotment levels. In fact, 25% of sellers are right at the free allotment cutoff point. In this scenario, with the exception of the 5% of sellers who use only 50% of their allotment capacity, we could expect a chunk of the rest of the sellers to respond to the increased allotment.
So far it has been established that none of the sellers outside of the dashed green box would respond to an increase in allotment, however it is also plausible that not all sellers within the dashed green box will react. Within_ _the dashed green region, sellers with lower listing levels in the 20 allotment world may be more likely to respond to an increased allotment compared to those with higher listing levels. For example, in Chart 3 we assume that 70% of sellers who had 20 listings in the 20 free allotment world will scale, whereas only 20% of sellers who had 70 listings in the 20 allotment world will remain the same.This expectation is based on the assumption that sellers around the 20 free allotment cutoff are more likely to be fee-constrained, while those with higher listing levels, who pay for additional listings, are influenced more by strategic and operational constraints.

Chart 3: % of sellers who can scale, based on their listing levels in 20 allotment world
The implication of the above in Scenario 1.1 is that 70% of the 500k Consumer sellers who list 20 items i.e. 350k Consumer sellers can scale. While this is only 3.5% of Consumer sellers, it is still equal to a third of the number of Store sellers.
On the other hand, in Scenario 1.2, the application of Chart 3 results in 53% or 5.3M Consumer sellers who can scale.
Posts in the series: Intro, 1/7: Context and TAM, 2/7: A conceptual model, 3/7: Externalities and breaking even, 4/7: Dynamics over time, 5/7: Testing approach, inferring results, next steps if test fails , 6/7: Metrics , 7/7: Takeaway, Google Sheets with data