Does reducing fees increase revenue: A Conceptual Model [2/7]
Posts in the series: Intro, 1/7: Context and TAM, 2/7: A conceptual model, 3/7: Externalities and breaking even, 4/7: Dynamics over time, 5/7: Testing approach, inferring results, next steps if test fails , 6/7: Metrics , 7/7: Takeaway, Google Sheets with data
Section 2: What is the responsiveness of Listings and Listing Fees with free allotments?
So let’s say we are convinced that additional free listings will enable a non trivial number of sellers to scale. Now the question becomes, what will be the relationship between total listings and listing fees with changing allotments. Will the change be linear? What would be the rate of the change?
If we only have the listing behavior data from sellers in the 20 allotment world, then that data is not sufficient to know the sellers’ potential listing capacity. Instead we can build a simple model using reasonable assumptions to hypothesize seller scaling. We begin by considering the bounds of scaling. So first we look at the listings and listing fees in the 20 allotment world. Next we imagine the limits of sellers’ listing capacity by considering the scenario where sellers are offered unlimited free listings. From there we work back to listings made under interim free allotments.
To make our model digestible, we consider only a sample segment of these sellers i.e. those with 20, 30, 50 and 70 listings in the 20 allotment world. First of all, this sample segment is restricted to the sellers within the “dashed green lines region” i.e. those who made 15-70 listings in the 20 allotment world. This ensures that we can expect scaling behavior from this sample. Secondly the sample segment is associated with the paid listing behavior of sellers and can be thought of as Cusp Paid i.e. those who remain at the threshold of free listings by listing 20 items; Low Paid i.e. those who pay only $3 a month to list 30 items; Mid Paid - those who pay $9 a month to list 50 items and High Paid sellers who pay $15 a month to list 70 items. This is useful because each segment can be expected to have a different scaling pattern as we will see later.
To be clear, this model is not a forecast. **The variations in listings and fees with different allotments depend on 1)the initial seller distribution, 2)the percentage of sellers capable of scaling, 3)scaling capacity of the sellers who can scale, and 4)budgeting decisions of sellers who can scale. **Changes in any of the four aforementioned factors can change the shape of our curves. Not to mention the fact that we considered sample segments instead of all data points for simplicity. Even so, this model is a tool to conceptualize how our tests may play out, enabling us to prepare for second and third order effects proactively.
Having established the above, we now take a look at what constitutes the lower end of our listings and listing fees vs. free allotment levels chart.
Listings and fees in 20 free allotment world:
Suppose the listing distribution of sellers is as follows in the 20 free allotment world.
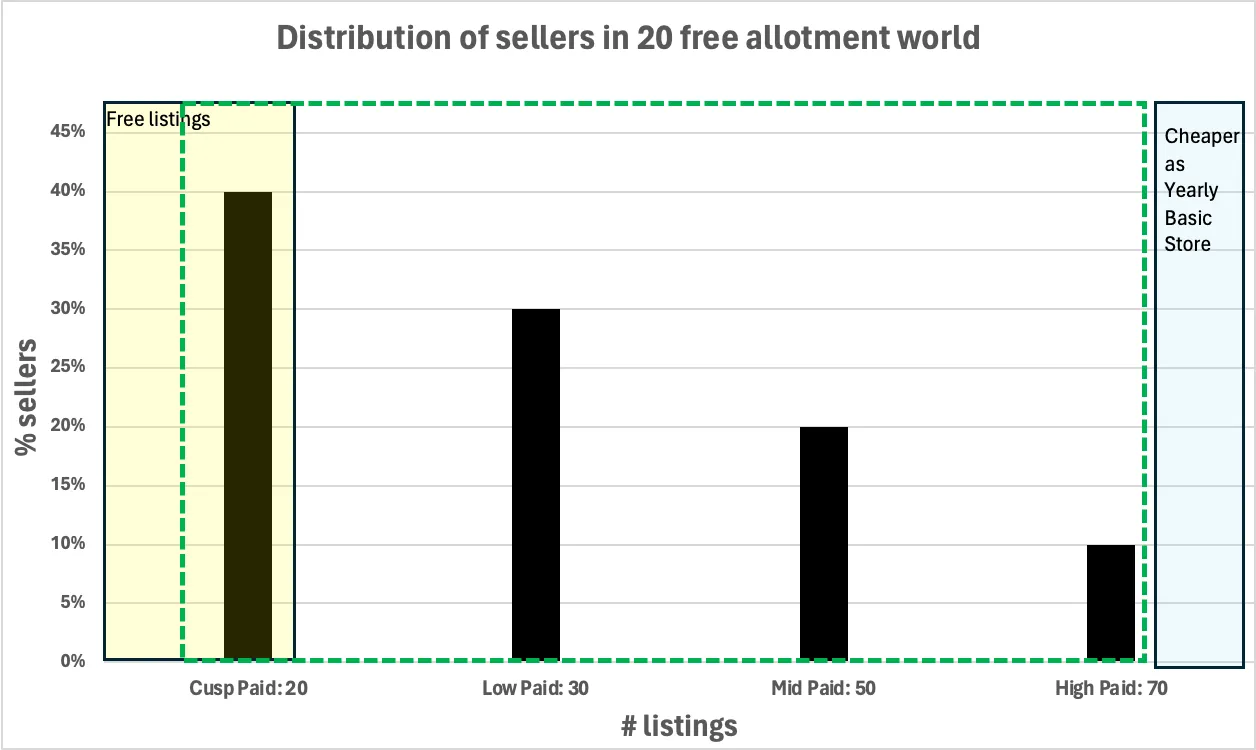
Chart 4: Depiction of sellers segmented by listing behavior: Cusp Paid, Low Paid, Mid Paid, High Paid
This distribution implies that there are a total of 340M listings and $42M in listing fees in the 20 free allotment world.
With the lower limit of our elasticity charts out of the way, we next consider the upper limit by imagining what happens when there are unlimited free listings.
Modeling listings and fees in an unlimited free allotment world (or how much sellers can scale):
In our model of unlimited listings we first of all keep consistent with our assumptions around sellers who scale from Chart 3.
Next we speculate that sellers at the lower listing levels in the 20 allotment world could increase their listings by a smaller absolute number; for instance, those who listed 20 items could potentially triple their output to 60 listings, necessitating 40 additional free listings. Conversely, sellers who listed 70 items in the 20 allotment world might at most double their listings to 140, requiring 70 additional free listings. Sellers with listing levels in between are likely to scale their listings within the range defined by Cusp Paid and High Paid groups.
The table below incorporates the above assumptions. The rows represent the sellers with their listing levels in the 20 free allotment world, while the columns indicate their listing level in the unlimited allotment world.
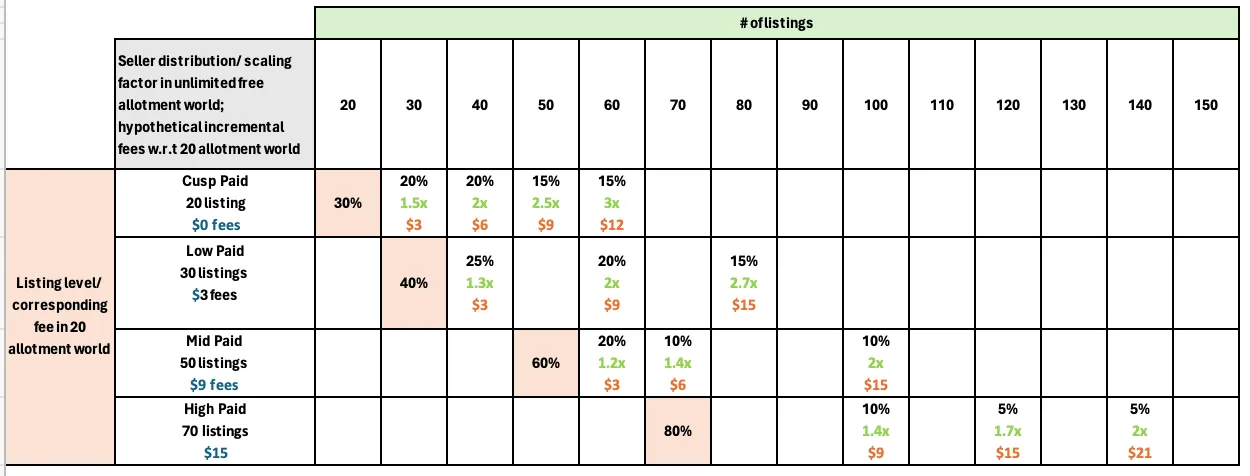
Table 3: Depiction of max scaling pattern of sellers segmented by listing behavior in 20 free allotment world
Based on the model in Table 4, there are a total of 481M listings and $0 in listing fees in the unlimited free allotment world. Per the model, the maximum listings that sellers may make is 140 items/month. So in other words, in our model unlimited allotment is equivalent to 140 free listings, meaning that there are a total of 481M listings and $0 in listing fees in the 140 free allotment world.
Now that we have the upper limit of seller listings, we can conceptualize how sellers may scale back on their listings in a world where they don’t have unlimited free listings but still have more free listings than the 20 free allotment world.
Modeling listings and fees in a 70 free allotment world (or how much sellers will scale):
Let’s consider setting the allotment level to 70 on top of the unlimited free listings model. This would mean that all the sellers to the left of the yellow bar in the table below would be able to list to their maximum capacity. But what about the sellers to the right of the yellow bar?
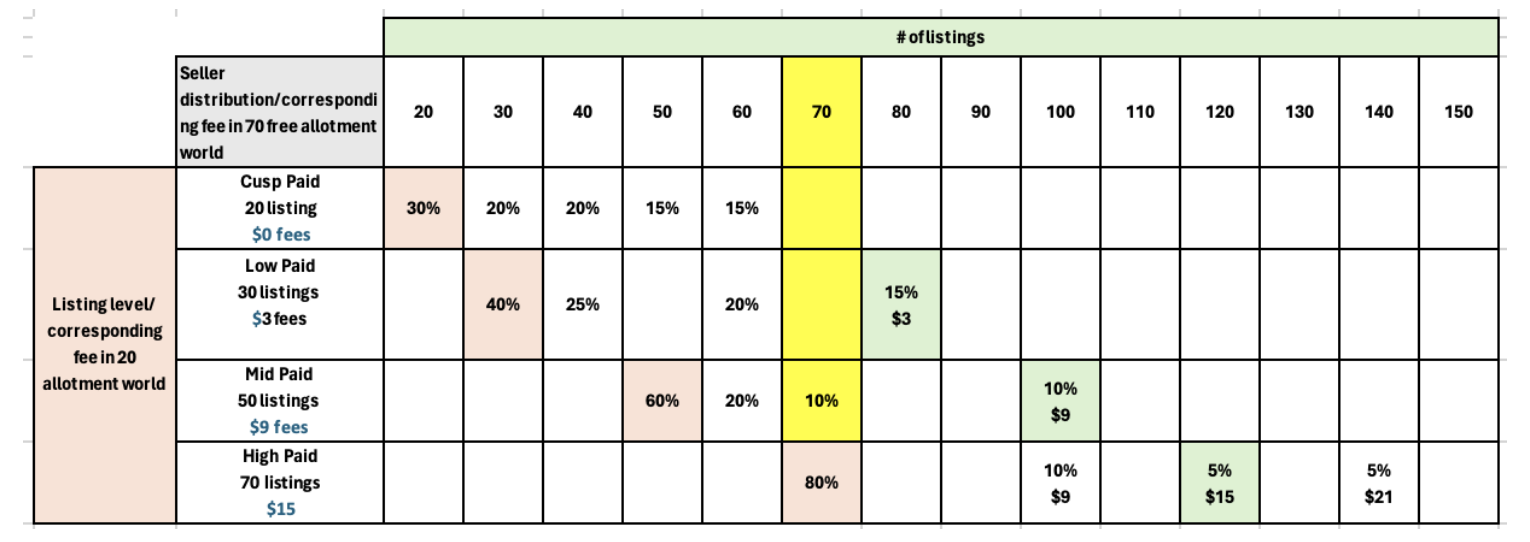
Table 4: Depiction of the amount sellers may have to pay to list at their max capacity, in a 70 free allotment world
The green cells to the right of the yellow bar represent listing levels in the 70 allotment world, where sellers would incur the same amount in fees as they did in the 20 allotment world. The sellers in the bottom row for instance paid $15 to list 70 items in the 20 allotment world; they can now list 120 items for the same fee in the 70 allotment world.
In this illustrative model, most sellers to the right of the yellow bar would naturally remain within their budget from the 20 free allotment world. The exception is the 5% of sellers who paid $15 to list 70 items in the 20 allotment world and would now have to pay $21 to reach their maximum capacity of 140 items in the 70 allotment world.
A conservative view on seller budgeting: Scenario 3.1
Previously, we considered how much sellers can scale when all listings are free. Now, we question how much they will scale when some e.g. 70 listings are free. Will sellers to the right of the yellow bar refrain from scaling unless it’s free, opting to spend less than their original budget? This scenario is depicted below, where sellers will only scale if the new allotment exceeds their listings in the 20 allotment world.
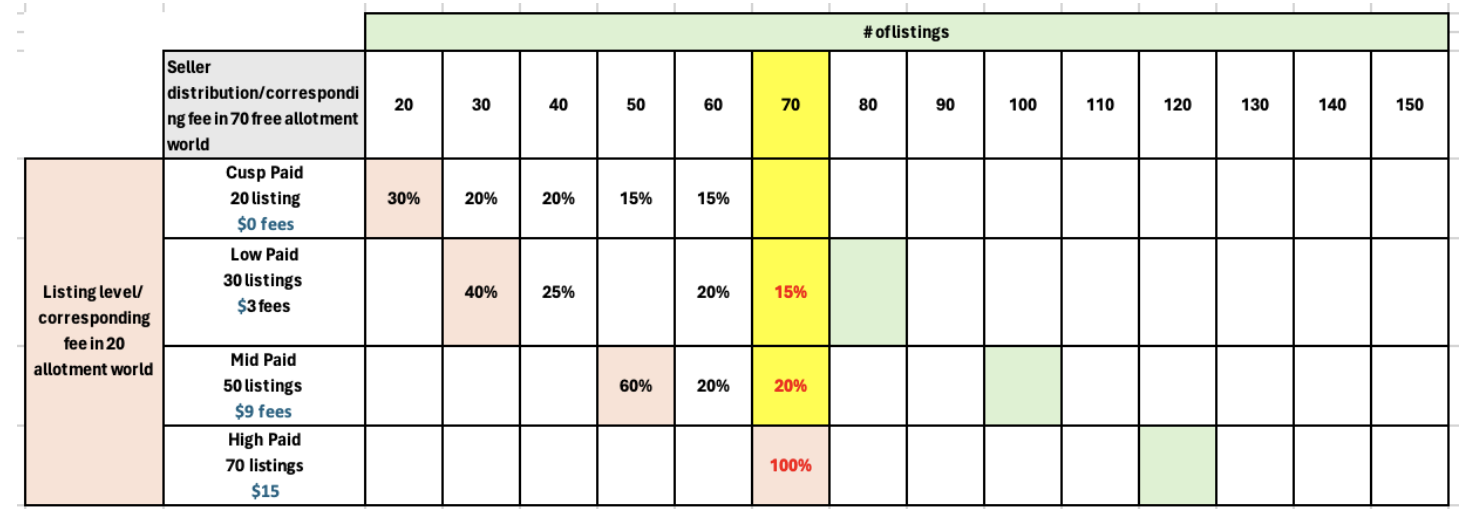 Table 5: Illustration of the conservative Scenario 3.1, where sellers opt to save instead of maintaining budget from 20 free allotment world to scale further
In the above table, sellers who listed 50 items in the 20 allotment world and could list up to 100 items for the same fee, choose to save money and only scale up to the free allotment of 70 listings.
In this scenario, there are a total of 461.5M listings and $0 in listing fees in the 70 free allotment world.
A relaxed view on seller budgeting: Scenario 3.2
Alternatively, we can imagine a scenario where sellers are less conservative with their listing budget and are willing to scale up to their original spend as in the 20 free allotment world. This is shown below.
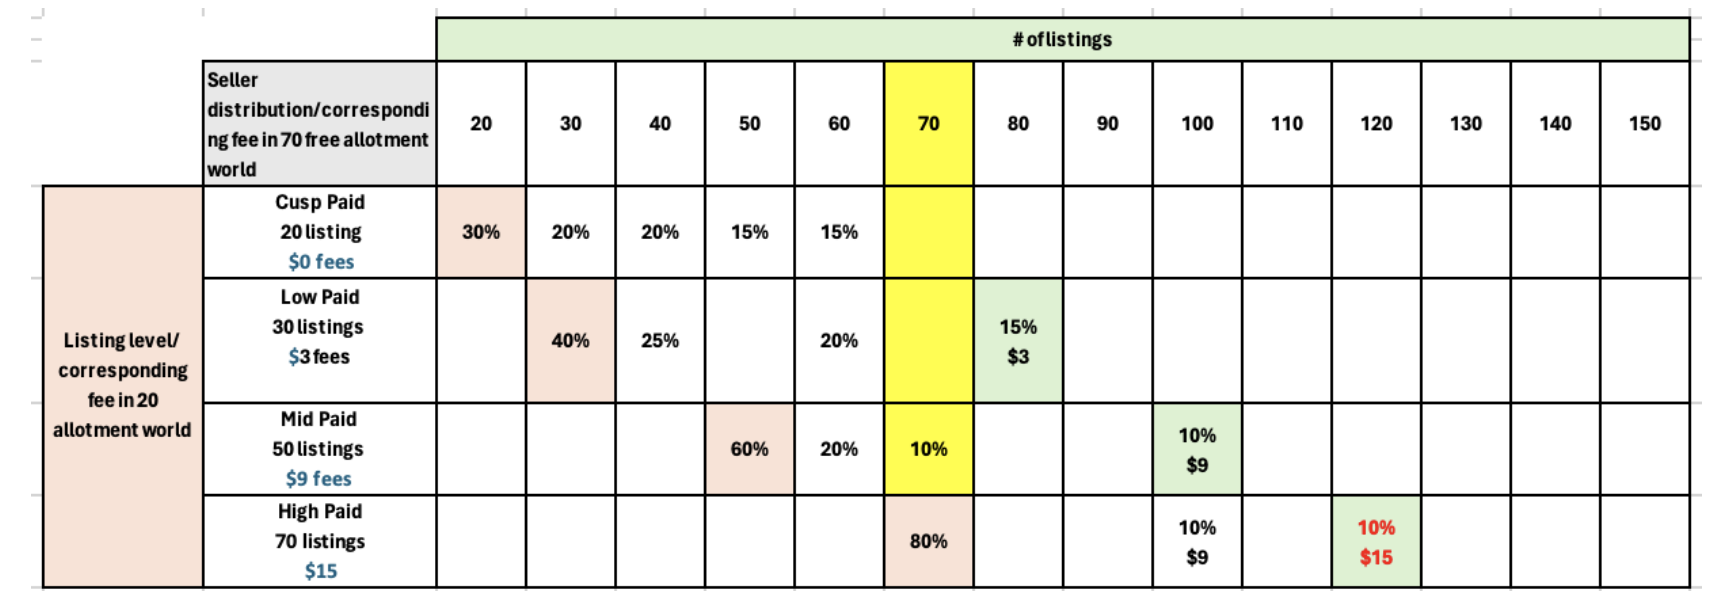 Table 6: Illustration of the less conservative Scenario 3.2, where sellers opt to maintain budget from 20 free allotment world to scale further
Here, sellers are content to keep their listing budget constant. If they can scale, they’ll do so up to their budget from the 20 allotment world. For instance, sellers who listed 50 items previously and can now list up to 100 will continue to pay the same amount to list 100 items. Conversely, the 5% of sellers who would need to pay $21 to list 140 items will stick to their budget of $15 and list 120 items.
In this scenario, there are a total of 480M listings and $5.5M in listing fees in the 70 free allotment world.
A complex view on seller budgeting: Scenario 3.3
The previous two budgeting scenarios discussed were simple-either sellers scaled only up to the free allotment, thereby saving their budget entirely or they scaled as much as their original budget would allow.
But might sellers, motivated by the additional free allotments, expand beyond their original budget? So perhaps, sellers who paid $15 to list 70 items in the 20 allotment world, will now pay $21 to list 140 items in the 70 allotment world?
Or could it be a mix of all scenarios, as in Table 8 below? Some sellers might maintain, reduce, or even exceed their original budget based on the new allotment incentives.
Consider for instance, the 10% sellers who listed 50 items in the 20 allotment world and can scale up to 100 items – some of them will maintain their original budget of $9 to list 100 items in the 70 allotment world, while some will choose to partially save their budget and list 80 or 90 items, while some will choose to entirely save their budget and only list up to the free allotment of 70.
On the other hand, consider the 5% sellers who listed 70 items in the 20 allotment world and have a maximum scaling capacity of 140. These sellers may be motivated by their subsidy of 70 free allotment to extend beyond their original budget and pay $21 to list 140 items.
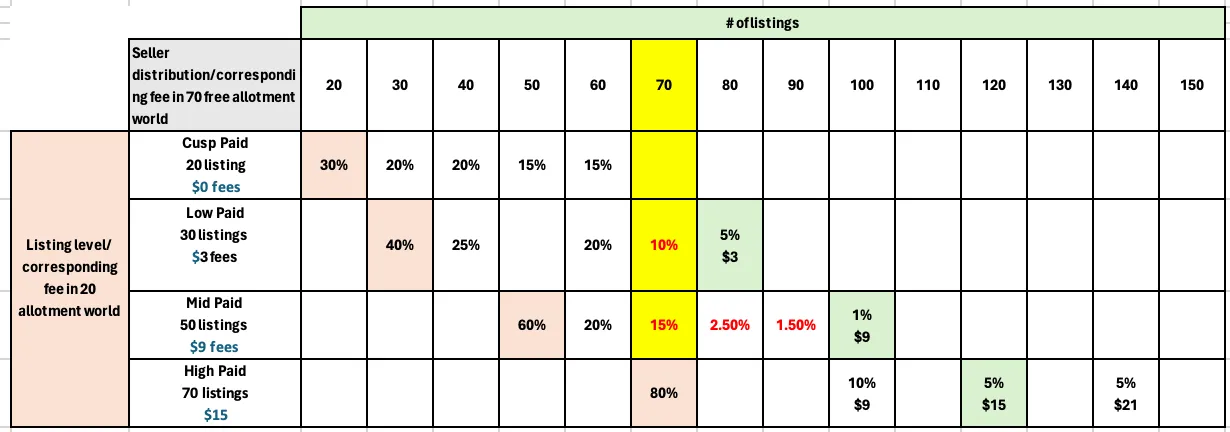
Table 7: Illustration of the mixed Scenario 3.3, where sellers demonstrate a range of behaviors-something opting to save budget completely, some saving partially, some maintaining and some exceed budget from the 20 allotment world
This third scenario illustrates a complex array of seller behaviors impacting total listings and fees.In this scenario, there are a total of 473.7M listings and $3.7M in listing fees in the 70 free allotment world.
It can be seen that the listings and fees in this scenario are bounded by the listings and fees from the two prior scenarios. In fact, assuming that only a small percentage of sellers expand their budget due to additional allotments, it may be reasonable to expect Scenario 3.1 and 3.2 to serve as the lower and upper bounds for scaling for intermediate free allotment levels in general.
Listings and Listing Fees vs. allotment curves
Given listings and fees determined previously for 20 free allotments and unlimited free allotments, as well as using scenarios 3.1 and 3.2 to compute the bounds of intermediate free allotment levels, we obtain the chart below.
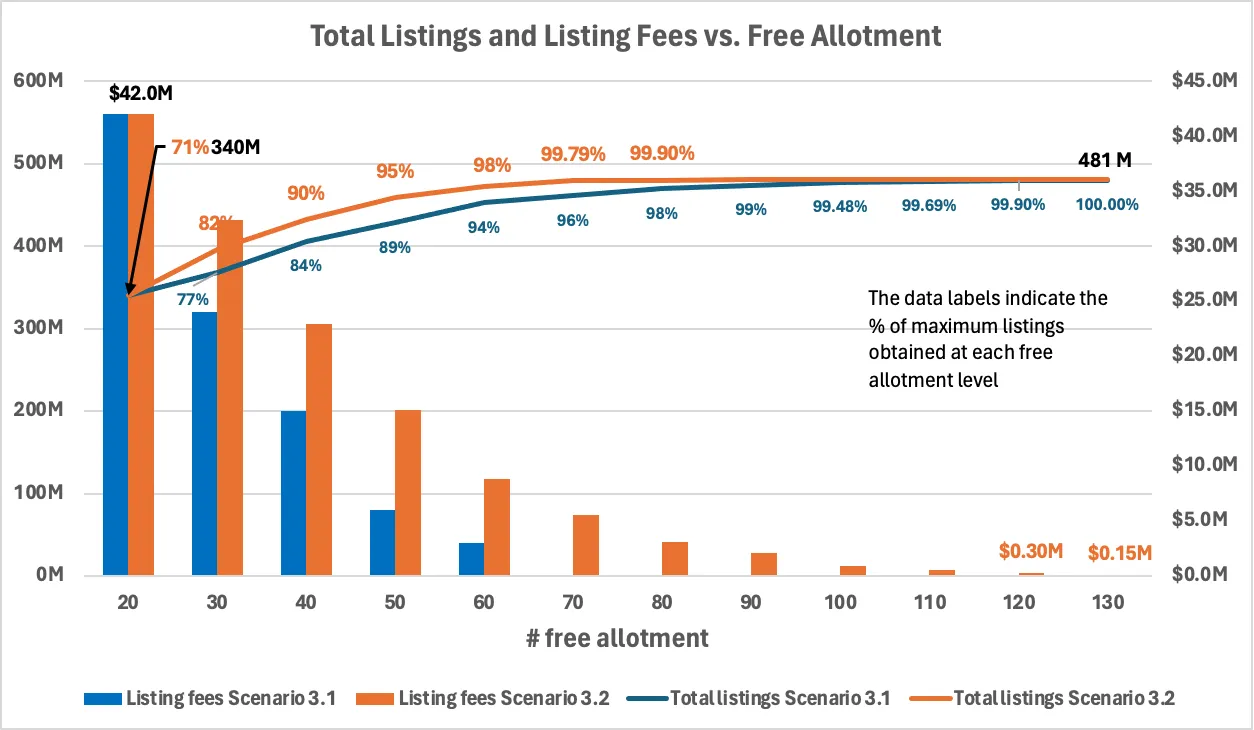
Chart 5: Relationship of total listings and listings fees with free allotment when sellers behave per Scenario 3.1 or 3.2
In our model, it can be seen that listings grow logarithmically while listing fees decrease exponentially. The listings growth of the conservative Scenario 3.1 is slower than that of the relaxed Scenario 3.2; while the listing fees decrease of Scenario 3.1 is faster than that of Scenario 3.2.
In our model, 71% of the maximum possible listings is obtained from the original 20 free allotment. 100% of the maximum possible listings is obtained by 90 free allotment in case of Scenario 3.2, and by 140 free allotment in case of Scenario 3.1.
This means that if things play out as in Scenario 3.2, there is a possibility for us to get maximum possible listings while still getting some listing fees – for instance, in case of Scenario 3.2, 100% of maximum listings can be obtained while still receiving $2.1M in listing fees.
Incremental Listings and Listing Fees vs. allotment curves
Since we are ultimately interested in the additional listings and fees compared to the 20 allotment level, an incremental view as below may be more insightful.
Let’s start with the incremental listing fees with respect to the 20 allotment world, as shown in Chart 6 below.
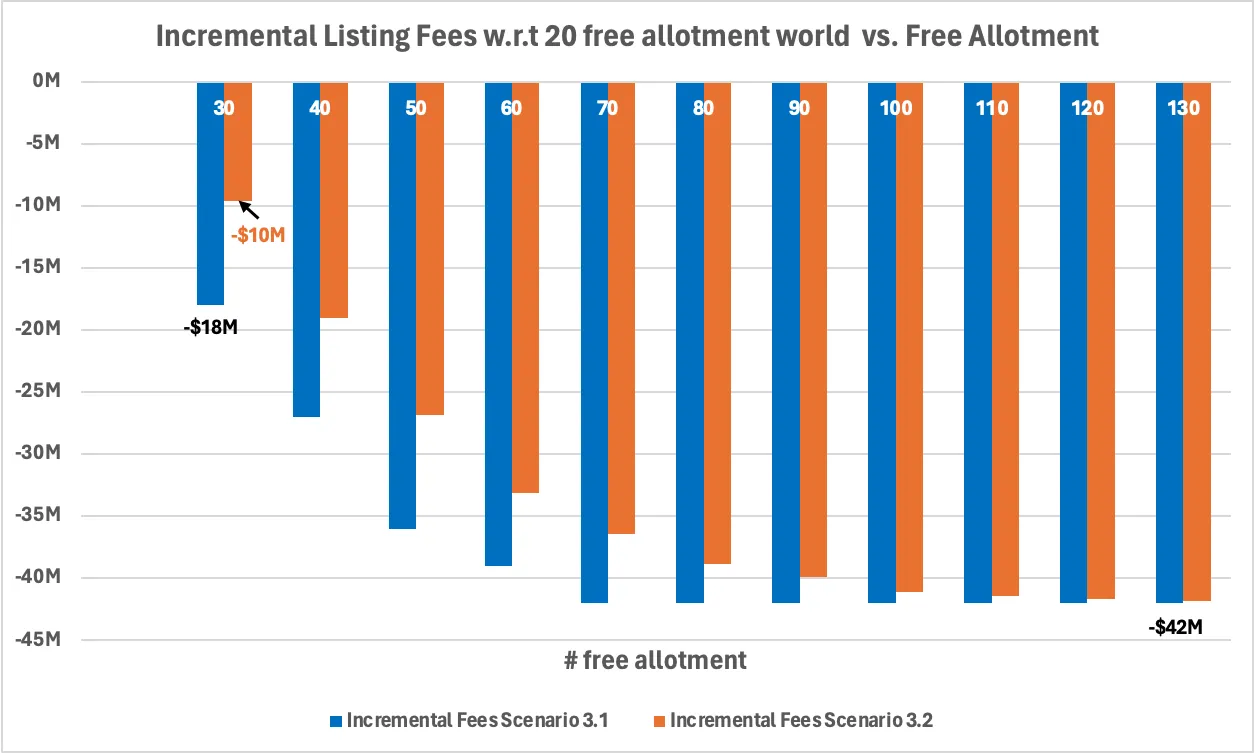
Chart 6: Incremental listing fees with respect to the 20 free allotment world, when sellers behave per Scenario 3.1 or 3.2
Since the marketplace is in a sense subsidizing the listing fees paid by the sellers by increasing free allotment, the incremental fees become more negative the more free listings we give away.
We would like to recoup this loss in listing fees and ideally make positive revenue through the sales of the additional listings shown in Chart 7 below. Of course ending up with net positive incremental fees would require a sufficient number of these additional listings to sell at a sufficient level of ASP. The required and possible sales and ASP values is something we will look into, in a later section.
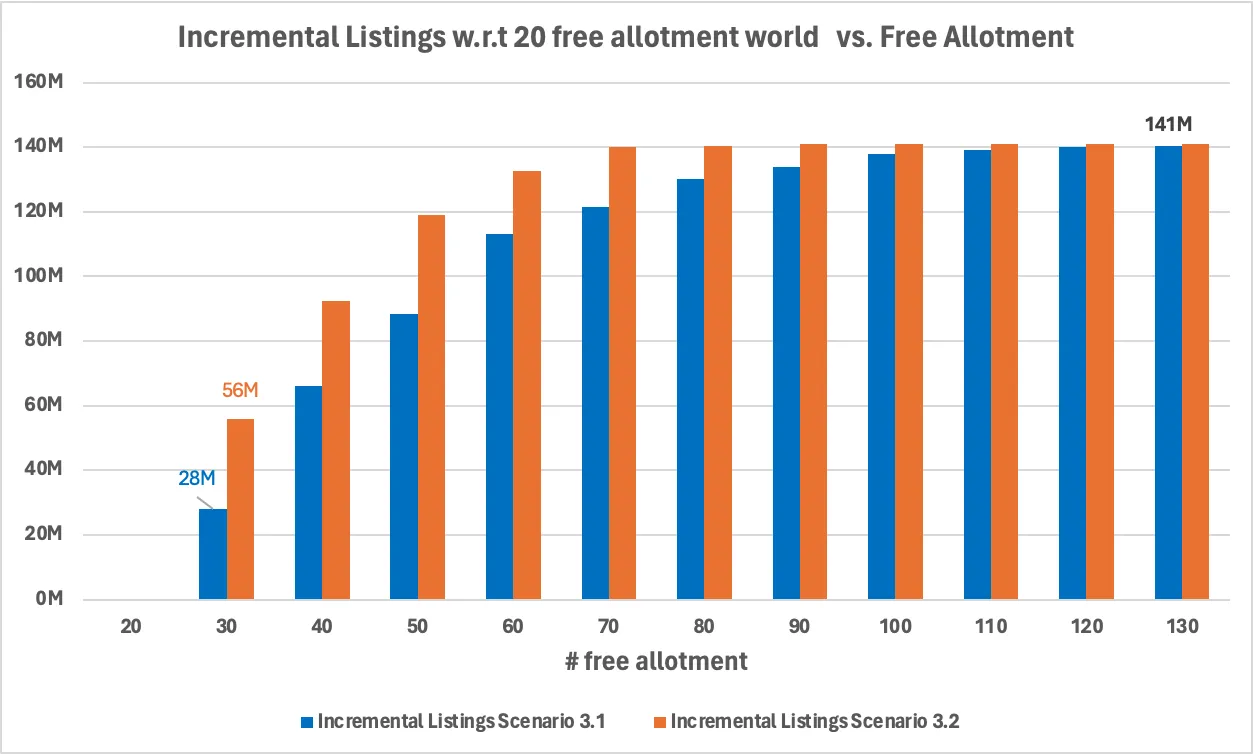
Chart 7: Incremental listings with respect to the 20 free allotment world, when sellers behave per Scenario 3.1 or 3.2
Forgone Listing Fees per Incremental Listings
This model helps reveal how cost/listing may vary quite distinctly with changing allotments, depending on user behavior. For Scenario 3.1, cost/listing decreases with increasing allotments, while the reverse is true for Scenario 3.2. This means that if things play out as Scenario 3.1, at lower levels of free allotments we would need items to sell at a higher price and conversion rate than at higher allotments.
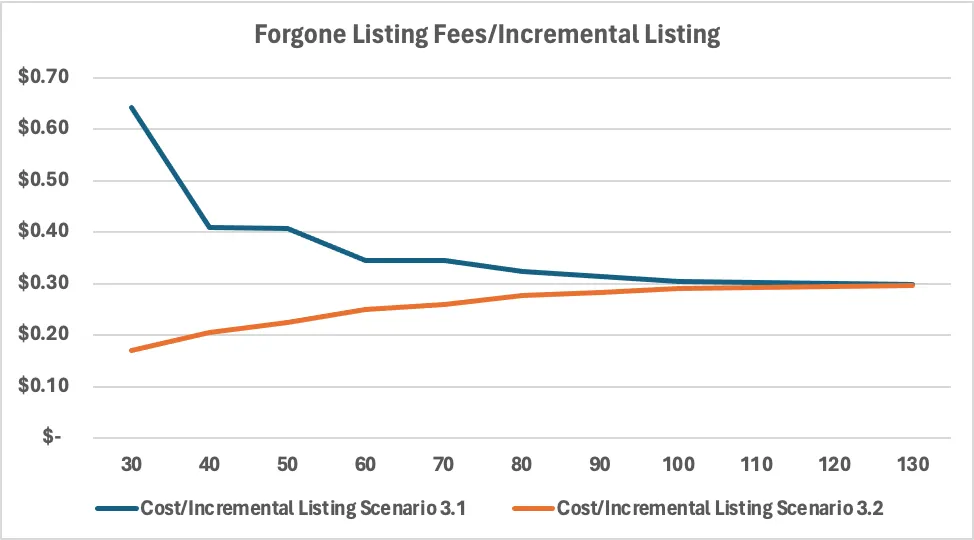
Chart 8: Forgone listing fees for each Incremental listings with respect to the 20 free allotment world, when sellers behave per Scenario 3.1 or 3.2
Put another way, while lower allotments may seem more economical in terms of overall forgone listing fees, they actually incur higher costs per listing in instances such as Scenario 3.1. With lower allotments in this scenario, not only is there a greater pressure for each listing to be sold, but the selling price must also be sufficiently high to cover the forgone listing fee costs.
Section 3: What might be other costs of an allotment change?
Even if we make our allotment changes only for Consumer Sellers, the impact may not just be limited to them but rather spillover to store sellers. This is illustrated below.
Suppose Basic Store sellers are distributed as follows (note that the distribution is such that average listings for Basic Stores is still 300, as referenced in Table 2):
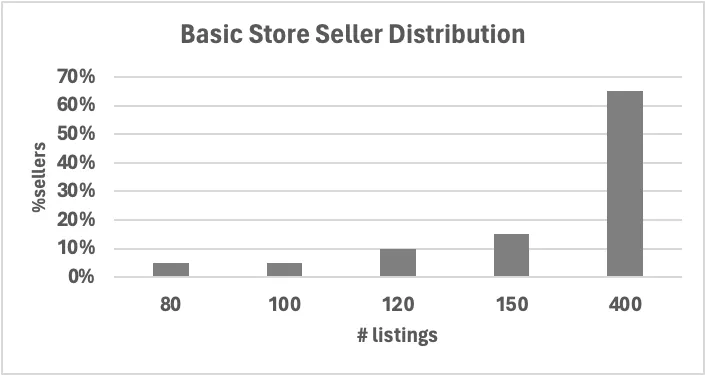
Chart 9: Basic Store Seller Distribution
Given the listing levels of some of these Basic Store sellers, it may be cheaper for them to list as Consumer Sellers instead of paying the Basic Store fees.
The table below shows what Basic Store sellers would be paying as Consumer sellers under various current listings and free allotment combinations. The region highlighted in yellow indicates when it is more economical to downgrade to a Consumer Seller

Table 8: Fees paid as a Consumer Seller under various listings and free allotment combinations
This next table illustrates the reduction in fees i.e. savings from the point of views of Basic Store sellers when they downgrade to become Consumer Sellers, at a per seller level.

Table 9: Forgone fees for downgraded Basic Store seller under various listings and free allotment combinations
However not all Basic Store sellers for whom it might make economic sense to downgrade from a_ fee_ perspective may opt to do so because it may not make sense for them from an overall perspective. For instance, being a Basic Store allows sellers access to sourcing, inventory management and seller analytics tools; it gives them access to create store pages to showcase their items and verified badges that engenders greater trust from buyers.
We may therefore consider various scenarios for Basic store downgrade. In each scenario we consider that the higher the Consumer seller free allotment level and the lower the Basic Store sellers’ listing level, the more likely to downgrade.
In the tables below we consider a more aggressive and less aggressive version of the downgrade assumptions. For instance in the more aggressive scenario, we consider that 50% of sellers who list 150 items as a Basic Store will downgrade to a Consumer Seller if 130 free listings is offered to the latter. In contrast in the less aggressive scenario, we assume none of the 150 lister Basic Store sellers will downgrade in the 130 free allotment world.
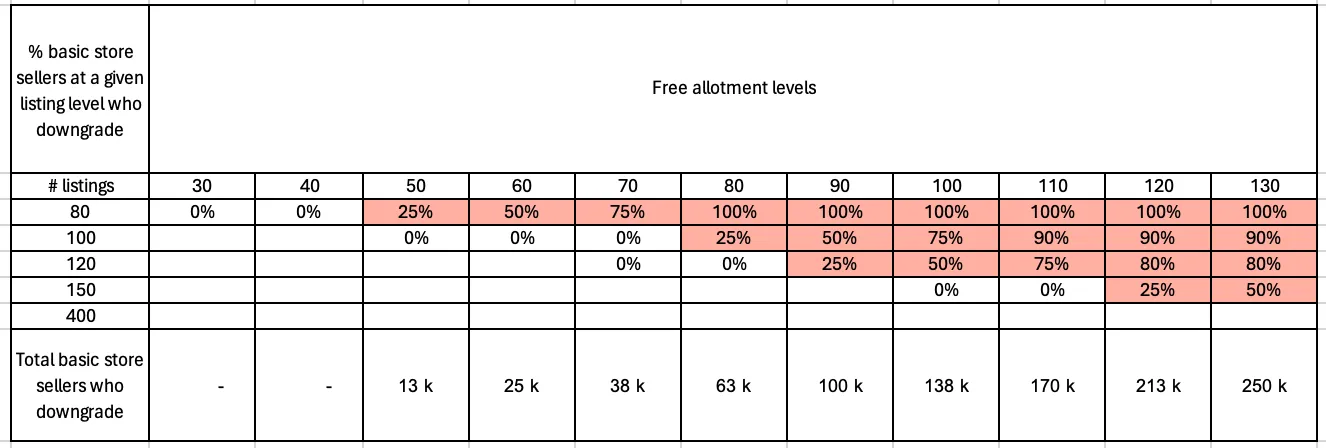
Table 10: % of Basic Store sellers who downgrade under an aggressive assumption
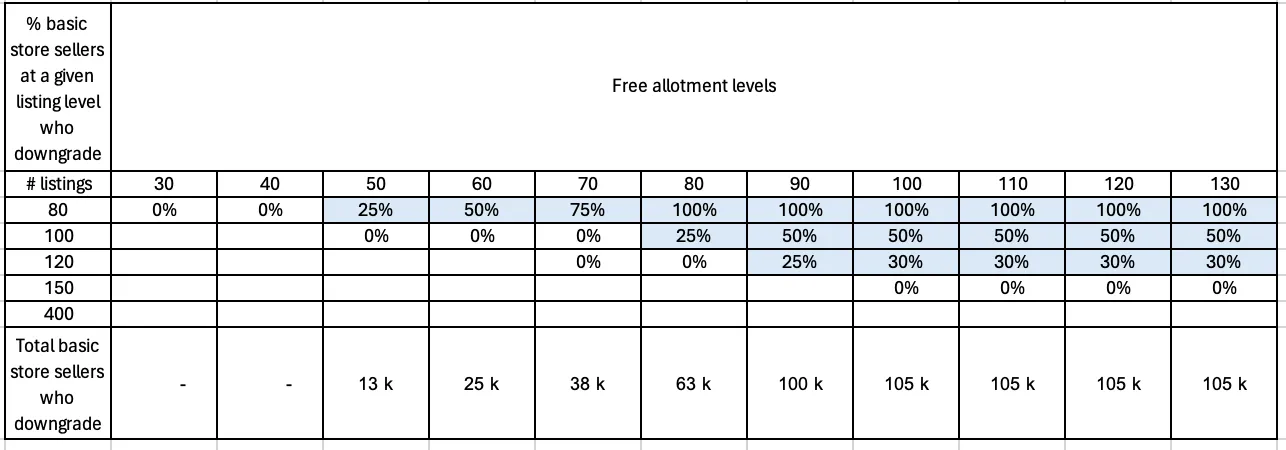
Table 11: % of Basic Store sellers who downgrade under a less aggressive assumption
Using the above information and assumptions, we can plot the forgone fees chart as shown below. We see that the shape of the charts are the same in both scenarios i.e. forgone fees increase with increasing free allotment. Even for our less conservative scenario, the forgone fees may be quite significant.
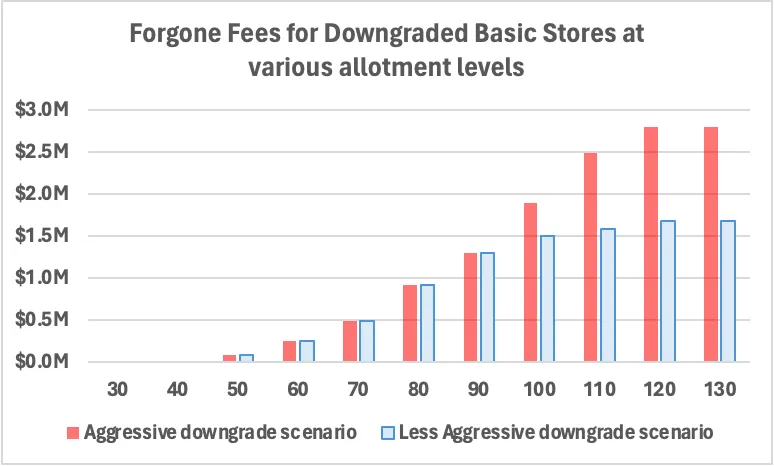
Chart 10: Total Forgone Fees for downgraded Basic Stores at various allotment levels
In short, higher the free allotment, the more reason for Basic Store sellers to downgrade and therefore the greater the loss in fees to the marketplace.
Now let’s find the total forgone fees i.e. forgone listing fees + forgone basic store fees for each incremental listing. This will let us know how much negative impact we would need to overcome through sales of the incremental listings.
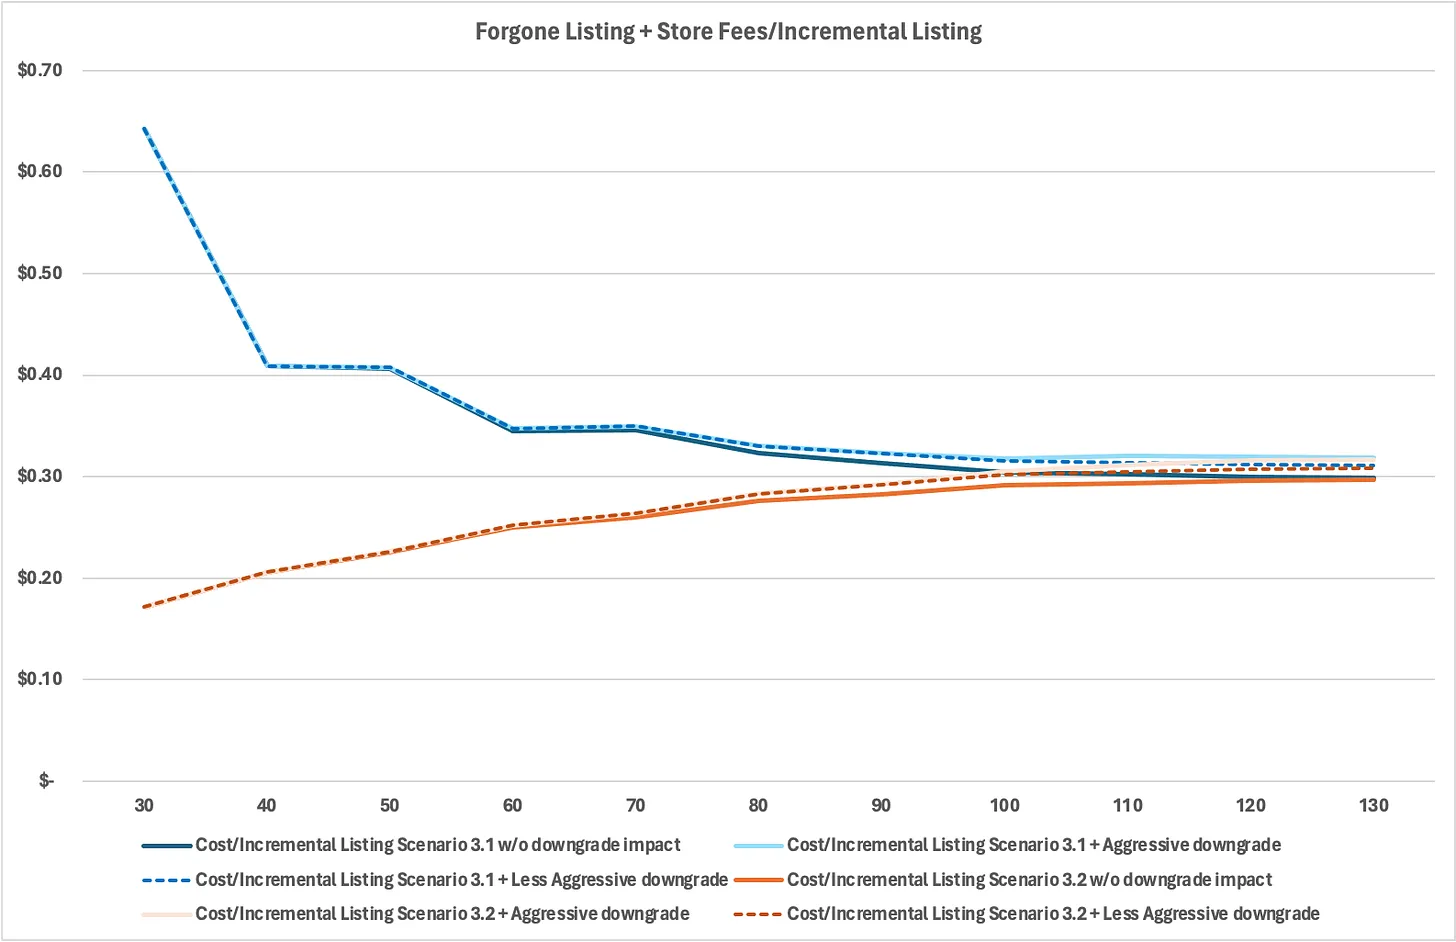
Chart 11: Total Forgone Listing and Store Fees for each Incremental listings with respect to the 20 free allotment world, when sellers behave per Scenario 3.1 or 3.2 w and w/o various downgrade impact
The above chart shows that the store impact only starts from 50 free allotments and even at the highest allotment level and most aggressive estimation, the impact is pretty minimal i.e. it only adds $0.02 or 7% increase to the forgone fees in either scenario.
The next section explores the conditions for recouping the forgone cost per incremental listing in order to breakeven.
Posts in the series: Intro, 1/7: Context and TAM, 2/7: A conceptual model, 3/7: Externalities and breaking even, 4/7: Dynamics over time, 5/7: Testing approach, inferring results, next steps if test fails , 6/7: Metrics , 7/7: Takeaway, Google Sheets with data