Does reducing fees increase revenue: Dynamics over time [4/7]
Posts in the series: Intro, 1/7: Context and TAM, 2/7: A conceptual model, 3/7: Externalities and breaking even, 4/7: Dynamics over time, 5/7: Testing approach, inferring results, next steps if test fails , 6/7: Metrics , 7/7: Takeaway, Google Sheets with data
Section 5: How might allotment changes impact marketplace dynamics over time?
All that we have examined so far assumed a fixed point in time, particularly when the allotment changes were first introduced. However, unlike the 20-allotment world, which has been around long enough to reach a steady state, new allotment levels may cause listing volumes to fluctuate for some time.
Positive flywheel
We might for instance have a situation where more inventory attracts more buyers, which in turn attracts more sellers, that results in a virtuous cycle of more inventory, more buyers and so on.
Listings mix change
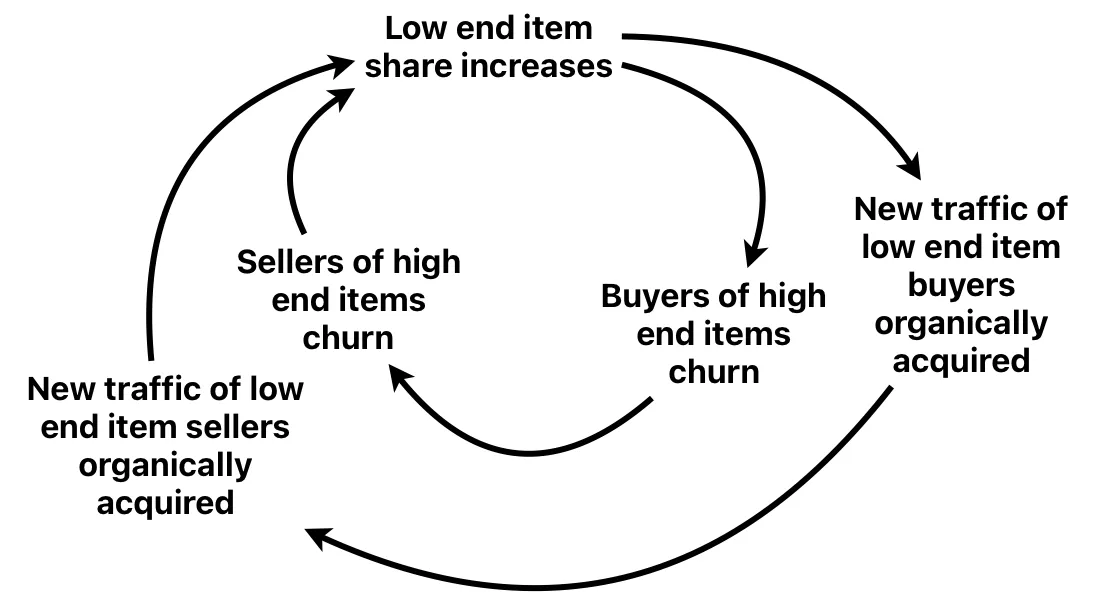
Or we may have a more complex flywheel as shown in Chart 17. Suppose the listings mix on the site changes i.e. as allotment is increased the additional listings are all lower end items. While these additional items have found a market on the site and are converting, their presence is changing the perception of the marketplace amongst both buyers and sellers.

Figure 1: Listings mix may change over time
In a case like the above, incremental sold items may or may not increase depending on the balance between churned and acquired buyers i.e. we may end up with a positive or negative flywheel. In either case the ASP of sold items would be lower. Sales fees and therefore incremental revenue may or may not increase depending on whether sold items increase enough to offset the fall in ASP.
Dynamics influenced by listings volume and therefore allotment
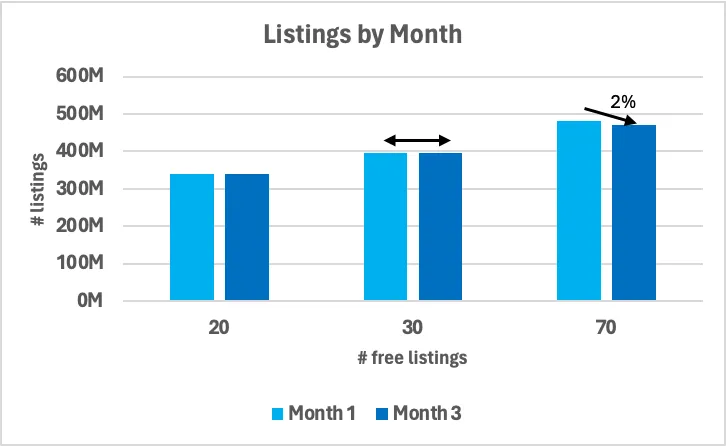
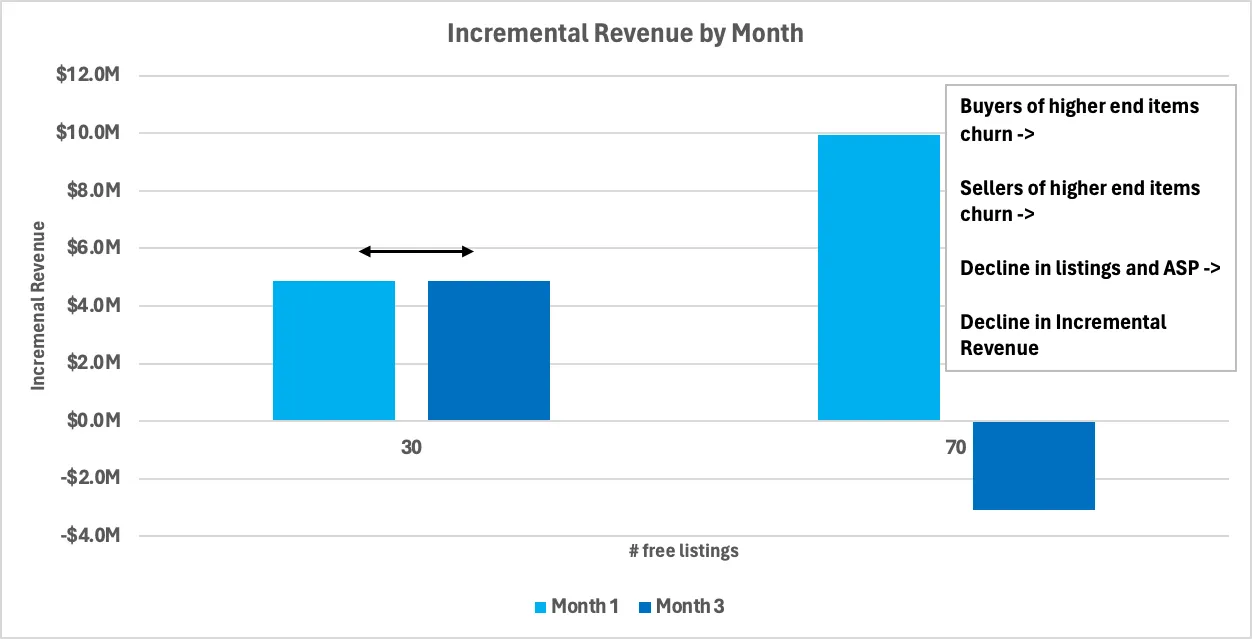
One thing to note is that the flywheel may only kick off if the initial increase in listings is large enough to cause a noticeable change in selection or listings mix. For example, there is an 8% to 16% increase in listings for Scenario 3.1 and 3.2, respectively, for 30 free allotments compared to 20 free allotments. This level of listings increase may not be sufficient to trigger a flywheel effect. However, a listings increase of 36% to 41% observed at an allotment of 70 may set the flywheel in motion. An illustration of what this might look like are in the charts below.

Chart 15: Illustration of how listings may change over time. The 20 allotment world is already in steady state and therefore remains stable over time; here it is imagined that the listings increase in 30 allotment world is not substantial enough to change marketplace dynamics and also remains stable over time; the listings increase in the 70 allotment world is imagined to be large enough to trigger a flywheel effect (negative in this case) and result in a 2% listings drop by Month 3

Chart 16: Incremental revenue corresponding to the listings change from Chart 18. Additional assumption includes decline in ASP from $19 to $18 from Month 1 to Month 3 in case of 70 free allotments.
Posts in the series: Intro, 1/7: Context and TAM, 2/7: A conceptual model, 3/7: Externalities and breaking even, 4/7: Dynamics over time, 5/7: Testing approach, inferring results, next steps if test fails , 6/7: Metrics , 7/7: Takeaway, Google Sheets with data