Does reducing fees increase revenue: Externalities and breaking even [3/7]
Posts in the series: Intro, 1/7: Context and TAM, 2/7: A conceptual model, 3/7: Externalities and breaking even, 4/7: Dynamics over time, 5/7: Testing approach, inferring results, next steps if test fails , 6/7: Metrics , 7/7: Takeaway, Google Sheets with data
Section 3: What might be other costs of an allotment change?
Even if we make our allotment changes only for Consumer Sellers, the impact may not just be limited to them but rather spillover to store sellers. This is illustrated below.
Suppose Basic Store sellers are distributed as follows (note that the distribution is such that average listings for Basic Stores is still 300, as referenced in Table 2):
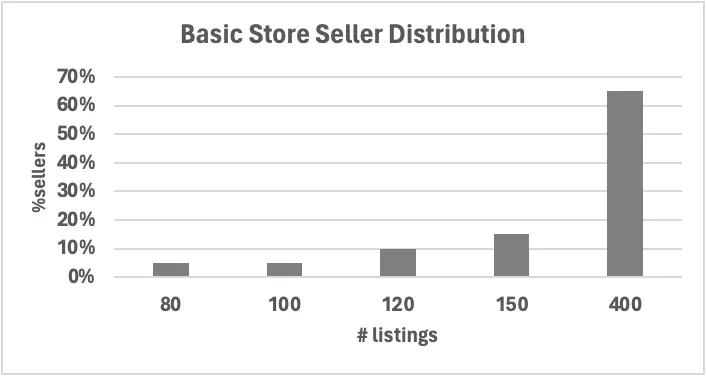
Chart 9: Basic Store Seller Distribution
Given the listing levels of some of these Basic Store sellers, it may be cheaper for them to list as Consumer Sellers instead of paying the Basic Store fees.
The table below shows what Basic Store sellers would be paying as Consumer sellers under various current listings and free allotment combinations. The region highlighted in yellow indicates when it is more economical to downgrade to a Consumer Seller

Table 8: Fees paid as a Consumer Seller under various listings and free allotment combinations
This next table illustrates the reduction in fees i.e. savings from the point of views of Basic Store sellers when they downgrade to become Consumer Sellers, at a per seller level.

Table 9: Forgone fees for downgraded Basic Store seller under various listings and free allotment combinations
However not all Basic Store sellers for whom it might make economic sense to downgrade from a_ fee_ perspective may opt to do so because it may not make sense for them from an overall perspective. For instance, being a Basic Store allows sellers access to sourcing, inventory management and seller analytics tools; it gives them access to create store pages to showcase their items and verified badges that engenders greater trust from buyers.
We may therefore consider various scenarios for Basic store downgrade. In each scenario we consider that the higher the Consumer seller free allotment level and the lower the Basic Store sellers’ listing level, the more likely to downgrade.
In the tables below we consider a more aggressive and less aggressive version of the downgrade assumptions. For instance in the more aggressive scenario, we consider that 50% of sellers who list 150 items as a Basic Store will downgrade to a Consumer Seller if 130 free listings is offered to the latter. In contrast in the less aggressive scenario, we assume none of the 150 lister Basic Store sellers will downgrade in the 130 free allotment world.
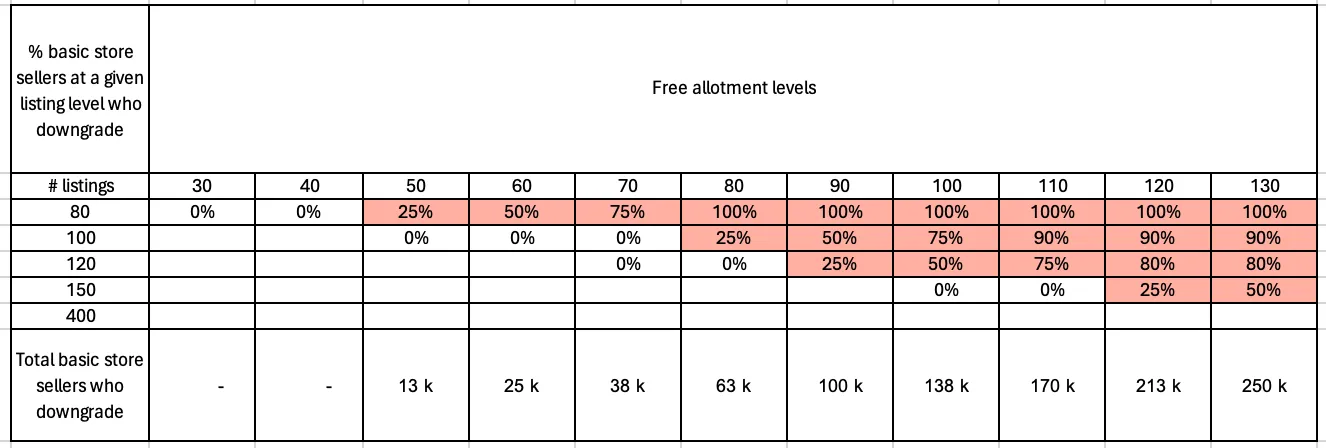
Table 10: % of Basic Store sellers who downgrade under an aggressive assumption
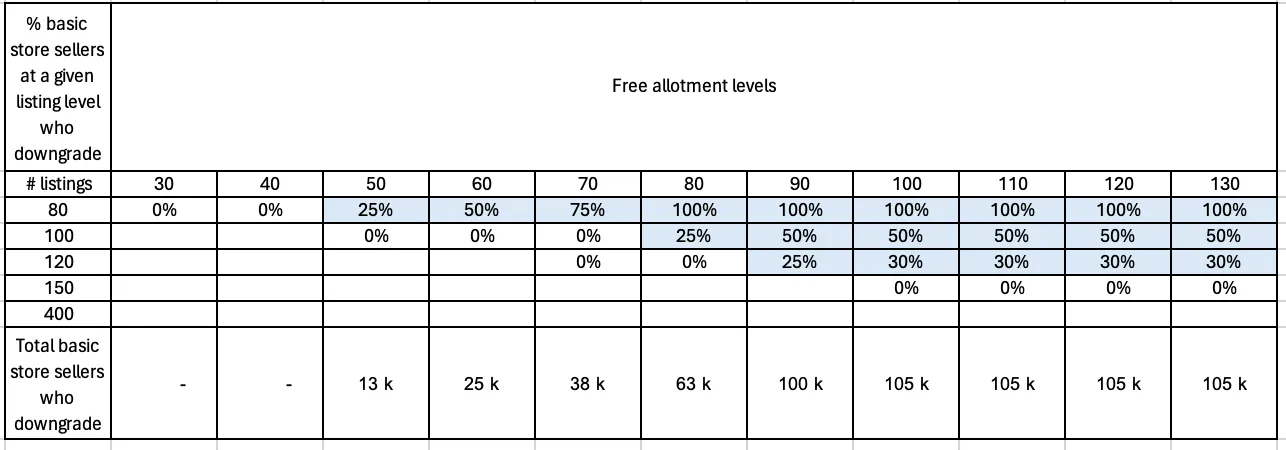
Table 11: % of Basic Store sellers who downgrade under a less aggressive assumption
Using the above information and assumptions, we can plot the forgone fees chart as shown below. We see that the shape of the charts are the same in both scenarios i.e. forgone fees increase with increasing free allotment. Even for our less conservative scenario, the forgone fees may be quite significant.
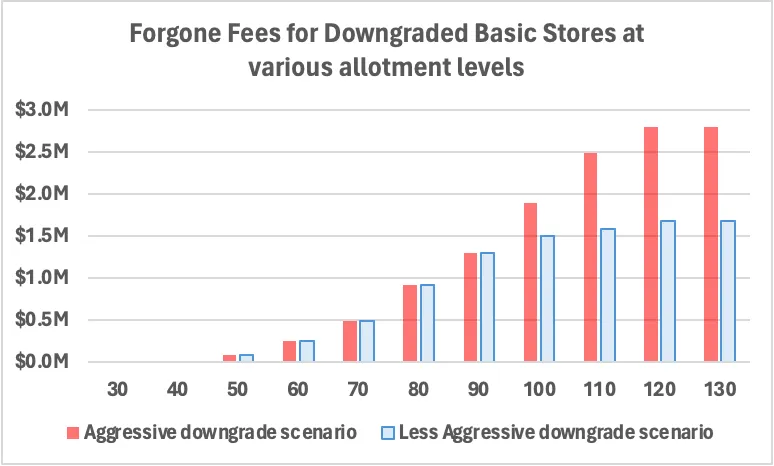
Chart 10: Total Forgone Fees for downgraded Basic Stores at various allotment levels
In short, higher the free allotment, the more reason for Basic Store sellers to downgrade and therefore the greater the loss in fees to the marketplace.
Now let’s find the total forgone fees i.e. forgone listing fees + forgone basic store fees for each incremental listing. This will let us know how much negative impact we would need to overcome through sales of the incremental listings.
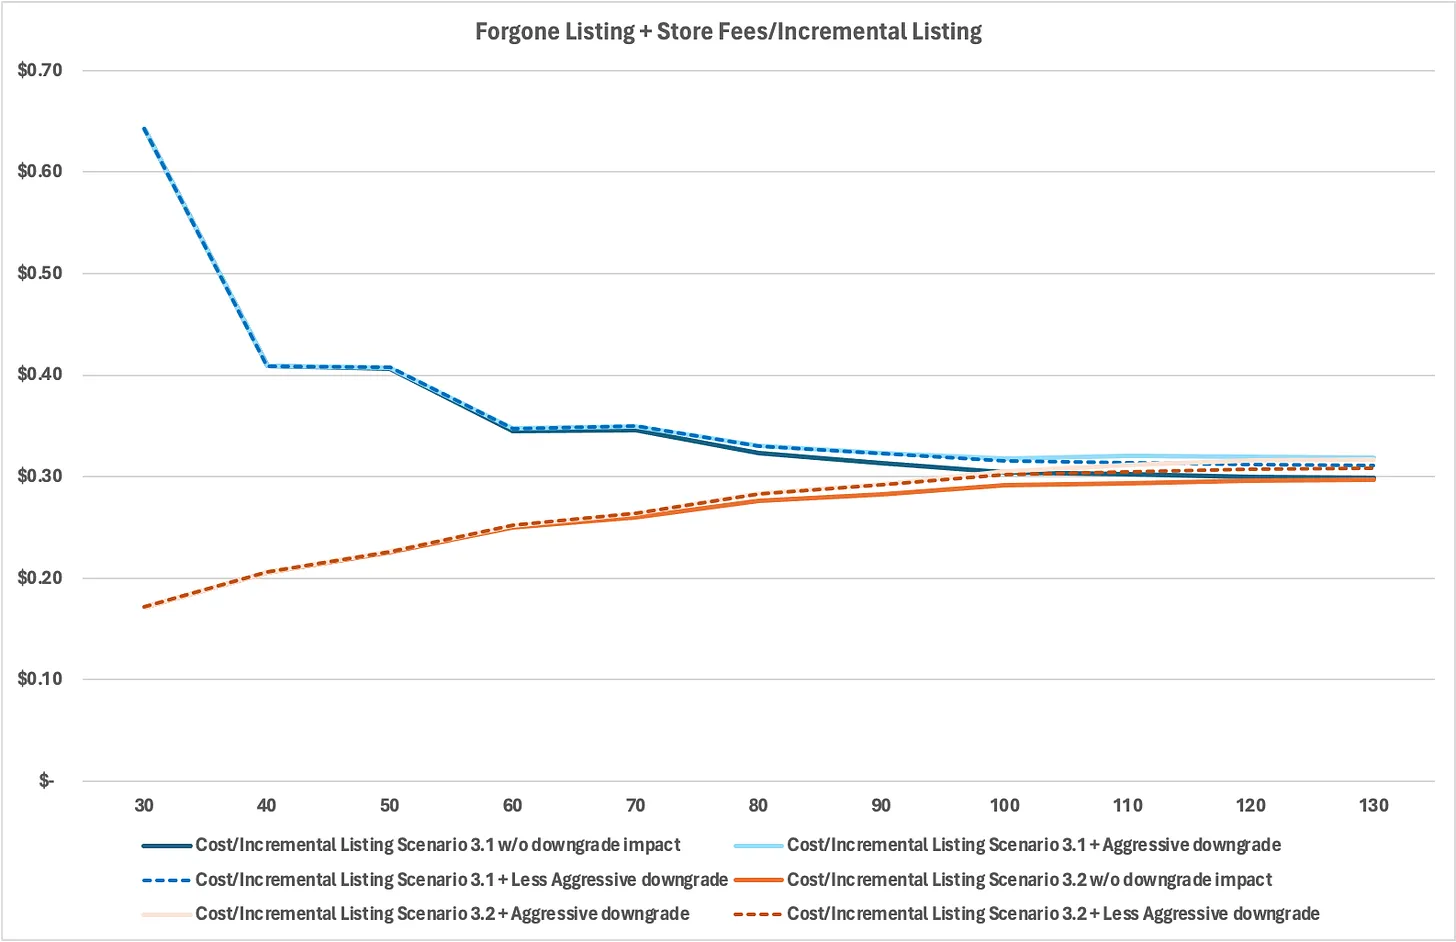
Chart 11: Total Forgone Listing and Store Fees for each Incremental listings with respect to the 20 free allotment world, when sellers behave per Scenario 3.1 or 3.2 w and w/o various downgrade impact
The above chart shows that the store impact only starts from 50 free allotments and even at the highest allotment level and most aggressive estimation, the impact is pretty minimal i.e. it only adds $0.02 or 7% increase to the forgone fees in either scenario.
The next section explores the conditions for recouping the forgone cost per incremental listing in order to breakeven.
Section 4: What needs to be true for a neutral to positive revenue for allotment change?
To keep things simple as we seek to understand what needs to happen for neutral to positive revenue as a result of allotment changes, we restrict ourselves to the best and worst-case scenario of forgone listing and store fees per incremental listing. In other words, we limit ourselves to the bounds of Chart 14 and only consider Scenario 3.1 with aggressive store downgrades and Scenario 3.2 without any downgrade impact.
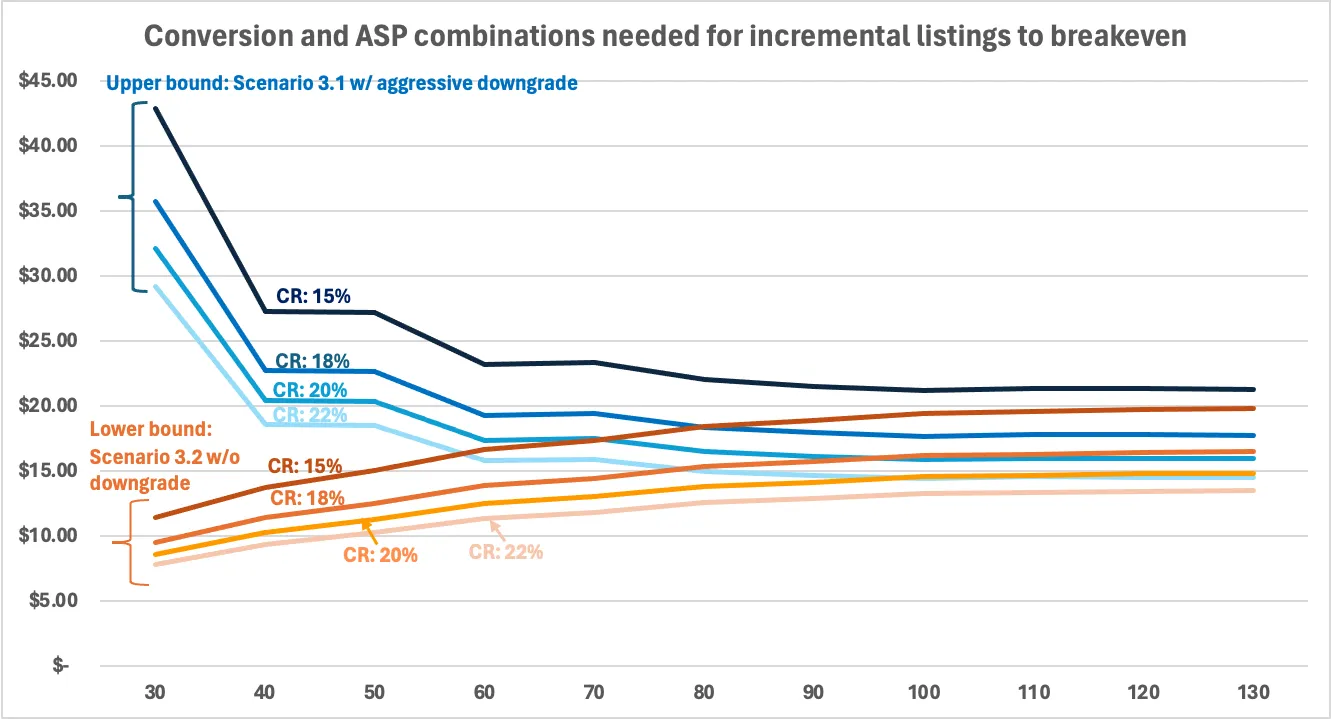
Chart 12: Conversion and ASP combinations needed to breakeven for Scenario 3.1 w/ aggressive downgrade and Scenario 3.2 w/o downgrade
The above chart shows that at lower allotment levels, depending on the scenario and the conversion rates, the required ASP for incremental listings to break even may be as low as $8 to as high as $43. However at higher levels of allotment the required ASP collapses to a narrower range. From 80 allotments, an ASP of just $22 can enable breakeven conditions even when conversion is as low as 15%.
As an aside, at lower allotment levels, the 15% conversion in Scenario 3.1 with aggressive store downgrades equates to a lower number of sales compared to 15% conversion in Scenario 3.2 without any downgrade. This is because the latter has a higher base i.e. more listings at lower allotment levels.
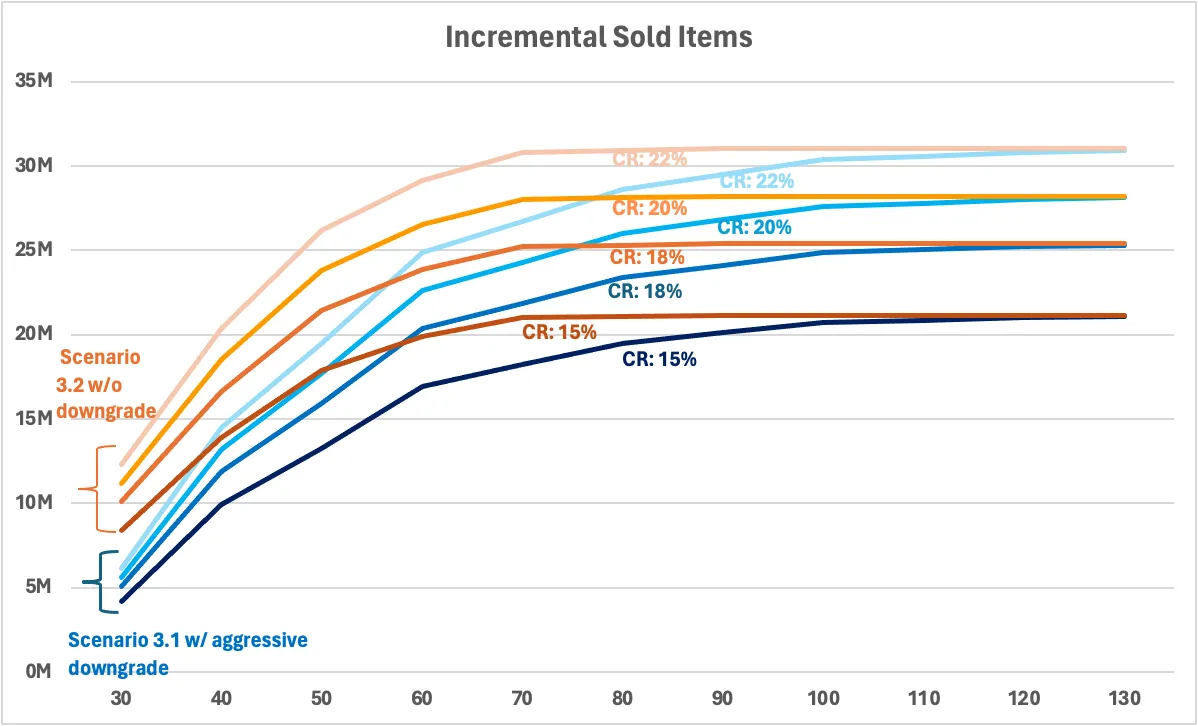
Chart 13: Incremental sold items corresponding to the conversion rates from Chart 15
Is this attainable?
So now we know the ASP and conversion combinations required to breakeven. But is this even attainable? To partly answer this, we compare the required sales to the current quantity demanded in the marketplace.
A rough estimate for current quantity demanded is the number of searches per month. This number stands at 325M for our marketplace. 193M of the searches are already fulfilled by the total sold items across Consumer in the 20 allotment world, along with Store sellers. This leaves 132M of unfilled demand to be addressed by the incremental listings.
Chart 13 illustrates that the number of sold items corresponding to the conversion and ASP combinations considered for breaking even is well below 132M. This may be a signal that there may be enough demand already present in the marketplace for the additional new listings.
In fact if we consider the ratio of unfulfilled quantity demand to new listings as in the chart below, we see as in Chart 14 below that the at its lowest, for every 100 new listings there are 94 unfulfilled searches meaning that even in the worst case the maximum possible conversion rate for the incremental listings would be 94%.
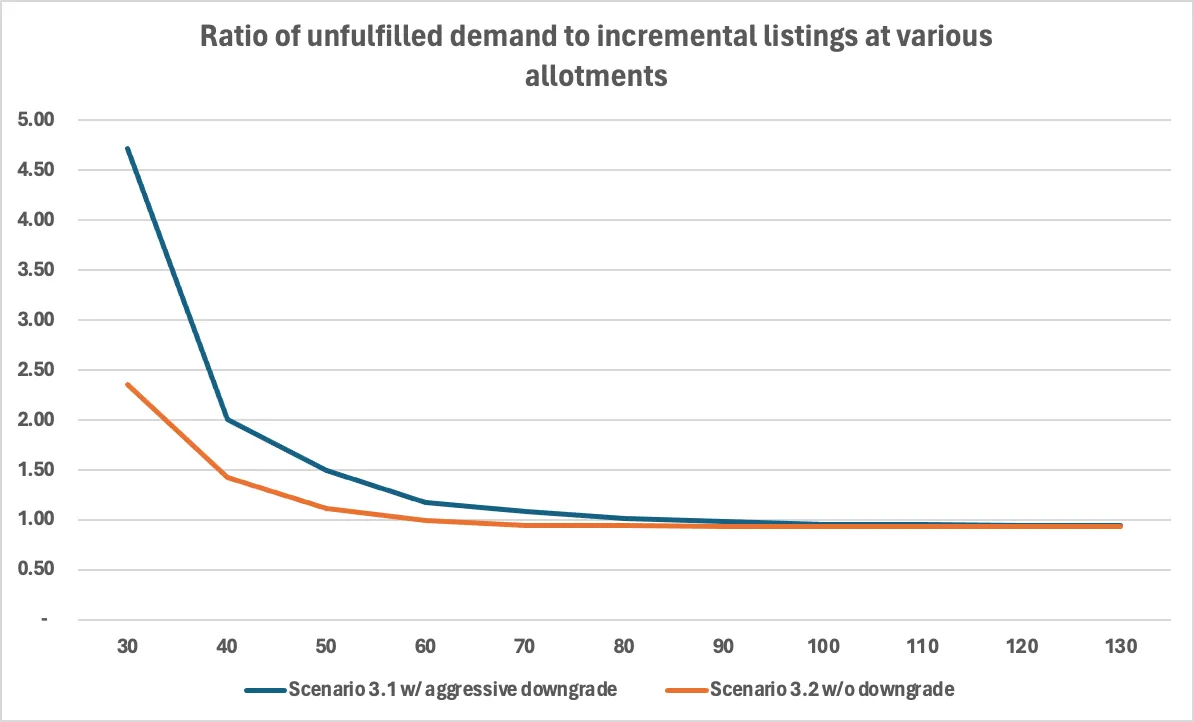
Chart 14: Ratio of unfulfilled demand to incremental listings at various allotments for Scenario 3.1 w/ aggressive downgrade and Scenario 3.2 w/o downgrade
Of course not all the searches map neatly into unfulfilled demand. There are searches for just browsing around, for price comparisons, for items where a substitute was ultimately purchased—these instances are challenging to identify and filter out resulting in unconverted searches being an overestimation for unfulfilled quantity demanded. Even so, if we take a 50% haircut on unconverted searches, this still leaves an opportunity for 50% conversion rate for our model.
The bigger challenge lies in whether the “right” items are brought to market. This encompasses not only what the items are but also whether they meet buyers’ expectations regarding factors such as price, shipping time, condition, brand, style, color, sizing, product reviews, or even listing quality and seller feedback scores.
We could guide sellers to bring in items associated with low search conversions; however, unless allotment increases are limited to adherence to such guidelines, there is no guarantee that sellers would comply. Moreover, this command-and-control approach might not be the most effective, since sellers, if left to their discretion, may bring in high-converting long-tail items that the marketplace or even buyers may not be aware of. Keeping sellers unrestricted also gives them the agility to respond to changing demands.
In short, while we may have signals indicating demand in the marketplace, whether the right inventory will be brought to market can only be determined through a test.
Posts in the series: Intro, 1/7: Context and TAM, 2/7: A conceptual model, 3/7: Externalities and breaking even, 4/7: Dynamics over time, 5/7: Testing approach, inferring results, next steps if test fails , 6/7: Metrics , 7/7: Takeaway, Google Sheets with data